
Blog · Market Updates
Phoenix Housing Market 2026: ZIP-Code Context
A market update for Phoenix is only as honest as its definitions. This 2026 snapshot gives the dated, sourced numbers for the metro, then explains how ZIP-level figures work, what each metric actually means, and why the reporting period, geography, and sample limits travel with every number.
 By Andrew Texidor Realtor · Founder, Clearly Sold Updated October 7, 2026
The direct answer
There is no single honest Phoenix number. As of this update, the dated metro-level figures show a market moving modestly in both directions depending on the measure: ARMLS's September 2026 STAT report (August 2026 data) put the Greater Phoenix median sales price at $445,000, down 1.1 percent month over month and up 1.1 percent year over year, while Zillow's Phoenix market page reported an average home value of about $410,000 as of mid-2026, a 2.1 percent year-over-year decline. ZIP-level figures, each with its own reporting window, vary across the city. The way to use this update is ZIP by ZIP, with the definition and period attached to every number, and never as an appraisal or a forecast.
Key takeaways
- There is no single honest Phoenix median for every question. Metro, ZIP, and neighborhood figures measure different things, and each one needs its source, geography, and reporting period attached.
- Distinguish sale price from asking price, and both from price per square foot. The three metrics answer different questions and cannot be substituted for one another.
- ZIP-level medians hide wide variation inside each ZIP. A median is the middle of a range, not a value uniform across the area.
- Coverage and sample limits matter. Figures built on few sales or narrow windows are less stable, and sources refresh ZIP pages on their own schedules.
- Market data is context, not an appraisal. Pricing a specific home starts with comparable sales of similar homes for that address.
What does the metro-level data show, with dates attached?
The most commonly quoted metro figure is ARMLS's median monthly sales price for Greater Phoenix. The September 2026 STAT report, covering August 2026 closings, reported a median sales price of $445,000, a 1.11 percent decrease from the prior month and a 1.14 percent increase from a year earlier. That figure is a median of sale prices, not asking prices, and it is metro-wide, so it averages very different ZIPs and home types together.
Zillow's Phoenix market page takes a different approach: its home value index is a modeled value for a typical home rather than a median of closed sales. As of its mid-2026 update, Zillow reported a Phoenix average home value of about $410,000, a 2.1 percent year-over-year decline, with a seasonally adjusted middle-tier typical value of about $390,000. A third reference point, Resideline's Phoenix market pages updated October 3, 2026, reported a citywide median sold price of $410,425 and a median of $267 per square foot over the preceding six months of closings.
These three figures differ because they measure different things over different windows. None of them is wrong; each needs its definition attached. That is the discipline this site follows, and the reason no single "the market is up" or "the market is down" sentence appears here.
How do ZIP-level figures work, and who publishes them?
ZIP-level data comes from two main families of sources. ARMLS publishes a quarterly housing summary by ZIP code based on recorded closings in Maricopa County, covering median and average sales price, days on market, closed sales, and the percentage of list price received. The most recent ZIP-level edition this update could verify was the first quarter of 2026, so per-ZIP medians for Phoenix must be read from that PDF with its quarter attached.
Portal sources such as Zillow maintain individual ZIP market pages that are refreshed on their own schedules, and they broaden the picture with price per square foot and inventory measures. Because each ZIP page refreshes independently, two ZIPs on the same site can show different reporting windows on the same day. The period on each page, not the page's existence, is what makes the figure usable.
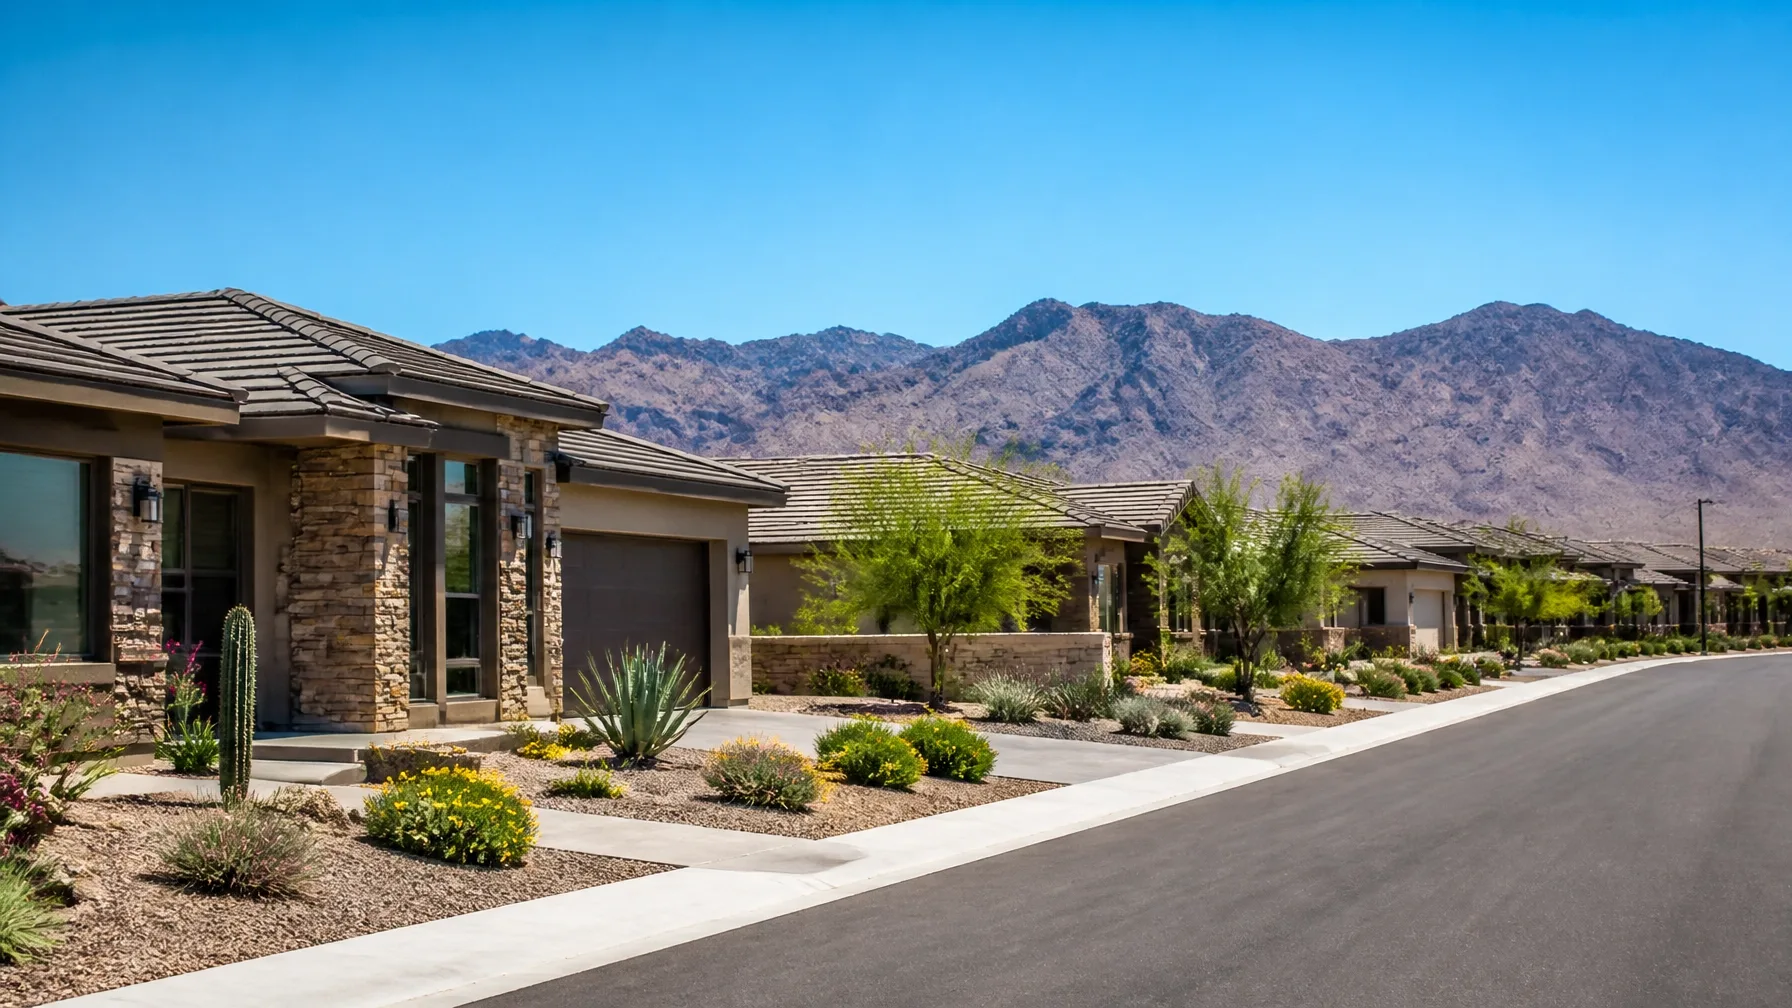
This update deliberately does not quote individual Phoenix ZIP medians: the sources' periods differ, the ARMLS ZIP summary lags a full quarter behind the metro STAT report, and quoting a ZIP median without a verified current figure would mislead. The honest instruction is to pull the current per-ZIP figures directly from the linked sources and attach each one's window.
How do you keep the metrics straight?
The four distinctions that prevent most misreadings are simple to state: sale price is what homes actually closed at; asking price is what sellers listed homes for; the list-to-sale gap is the difference; and price per square foot divides a home's price by its heated square footage, which makes it a different distribution entirely. A ZIP with a high median sale price can still show a low median price per square foot if the homes are large, and the reverse happens in areas with smaller homes.
For any figure, write down the metric, the geography, the period, and the definition before you use it. A figure missing any of those four is not yet a usable fact.
What are the coverage and sample limits?
Every ZIP statistic is built from the homes that closed inside that ZIP during that window, and the stability of the median depends on how many closings there were. Small ZIPs, rural edges, and short windows all produce medians that jump on a single sale. Sources disclose coverage in different ways: portal pages show their refresh date and window, while ARMLS's quarterly PDF states its quarter and geography. Read those notes before you quote anything.
How should you use this data for a real decision?
Use market data to frame a decision, then switch to property-specific evidence. For a buyer, the ZIP picture says which areas to shortlist and what recent activity looks like; the monthly payment and the appraisal come from the specific home. For a seller, the ZIP picture frames exposure and timing, but the list price comes from a comparative market analysis of similar homes that sold and similar homes now listed, not from a ZIP median.
A free market analysis from a local agent, built on comparable sales for your address, turns the ZIP context into a number you can act on. That analysis is an opinion of value for pricing purposes and is separate from a lender-ordered appraisal.
Reading any market figure: the four-part window
Metric
Median sale price is the middle sale price of the homes that closed in the window. Asking price is what sellers list. Price per square foot divides sale price by heated square footage and follows its own distribution.
Geography
Metro-wide figures average across all of Greater Phoenix. ZIP figures cover only the homes that closed inside that ZIP during that window. A ZIP is not a neighborhood.
Period
Each source reports its own window, from a single month to three months or a quarter. Two sources will rarely show the same period, so dates travel with the numbers.
Sample and coverage
ZIPs with few closings produce unstable medians. Sources state coverage limits and refresh cycles; read them before quoting a figure.
Frequently asked questions
What is the Phoenix median home price in 2026?
The honest answer depends on the source, the geography, and the period. ARMLS's September 2026 STAT report (August 2026 data) put the Greater Phoenix metro median sales price at $445,000, down 1.1 percent month over month and up 1.1 percent year over year. Zillow's Phoenix market page reported an average home value of about $410,000 as of mid-2026, a 2.1 percent year-over-year decline, with a seasonally adjusted middle-tier typical value around $390,000. Each is a different measure over a different window, which is exactly why the definition and period travel with the number.
Why do different sources show different Phoenix prices?
Sources use different metrics (median sale price, average value, price per square foot), different geographies (metro, city, ZIP), and different reporting periods. One source can legitimately show a decline while another shows a gain over a different window. The number is only useful with its definition and date attached.
Can I apply a ZIP median to a specific home?
No. ZIP medians describe the middle of a range across all home types in that ZIP for that window. A specific home is priced from comparable sales of similar homes: similar type, size, condition, and location within the area. Market data frames the picture; comparable sales set the price.
Is the Phoenix market up or down in 2026?
The dated figures above show modest movement in both directions depending on the measure and window. That is observation of recent data, not a forecast. No published figure predicts where prices go next, and none should be read that way.
Related resources
- Phoenix AZ Real Estate Market 2026 A current, dated and sourced read on the region's 2026 market and how to use the numbers.
- Glendale: prices and ZIP-code context The same ZIP-level treatment applied to Glendale, with metric definitions attached.
- Peoria: prices and ZIP-code context Dated, sourced ZIP-level medians for Peoria with reporting windows stated.
- Free Market Analysis A data-informed estimate for your specific address, using comparable sales rather than ZIP medians.
- Search current listings Browse live Phoenix-area inventory and see what is actually listed and selling.
- Buyer resources How financing, appraisals, and offers turn market context into a purchase.
Sources and dates: verified October 8, 2026. Metro figures from ARMLS's September 2026 STAT report (August 2026 data, Greater Phoenix median sales price $445,000) as summarized in published coverage; Zillow's Phoenix home values page (average home value approximately $410,000 as of the mid-2026 update, down 2.1 percent year over year); and Resideline's Phoenix market pages (updated October 3, 2026, six-month window). See the ARMLS quarterly ZIP summary and source links below for current per-ZIP data, each with its own reporting window.
Educational note: dated, sourced market data with methodology attached. It is not an appraisal, an affordability determination, a price prediction, or a forecast, and ZIP medians must not be applied to a specific home. Sources revise figures, and markets change.
Next step
Want to know what the numbers mean for your ZIP?
Bring us the figure you are looking at and we will tell you what it measures, what it leaves out, and what comparable sales say for your specific home. No jargon, no runaround.
- Phone
- 623-400-5957
- andrew@clearlysold.com